Your computer might slow down, freeze, restart unexpectedly, or run sluggishly without any apparent reason. In such cases, it’s important to pinpoint the root cause. One of the most effective tools for this purpose is the System Performance Report, which comes pre-installed in Windows. This feature gathers detailed insights about your system’s hardware, driver performance, system services, and more. By using it, you can identify underlying problems and make informed decisions to optimize your system.
In this article, we’ll explain what a performance report is, when it’s useful, and how to generate it manually on a Windows system.
What Is a Windows Performance Report?
A Performance Report in Windows is an automated analysis that evaluates the current state of your system’s hardware and software. It includes:
-
Information about the processor, memory, disks, and video adapters;
-
Diagnostics of installed drivers and system services;
-
Warnings about potential errors or conflicts;
-
Recommendations for improving performance;
-
Timestamps and detailed system load metrics.
This report is especially useful when early signs of system issues appear, and it’s also valuable for regular monitoring—such as in server environments or under high workloads.
When Do You Need a Performance Report?
Creating a performance report can help if:
-
Your computer is slowing down without an obvious reason;
-
You suspect overheating, CPU overload, or insufficient memory;
-
The system occasionally freezes or restarts;
-
You want to audit the stability and health of Windows after installing new hardware or updates;
-
A technical report is required for contacting support.
How to Generate a Performance Report in Windows
You can use a built-in tool in the Windows operating system to diagnose system performance:
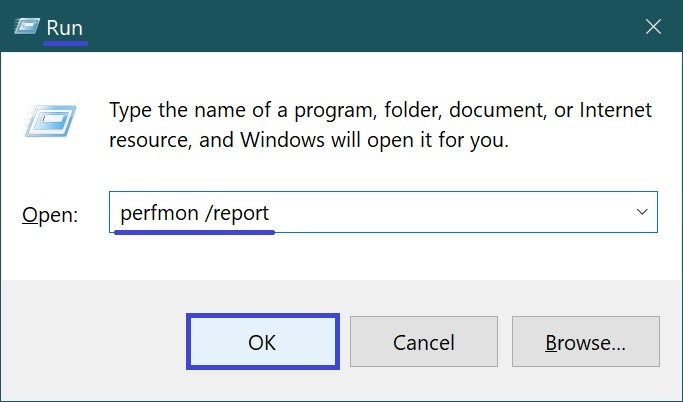
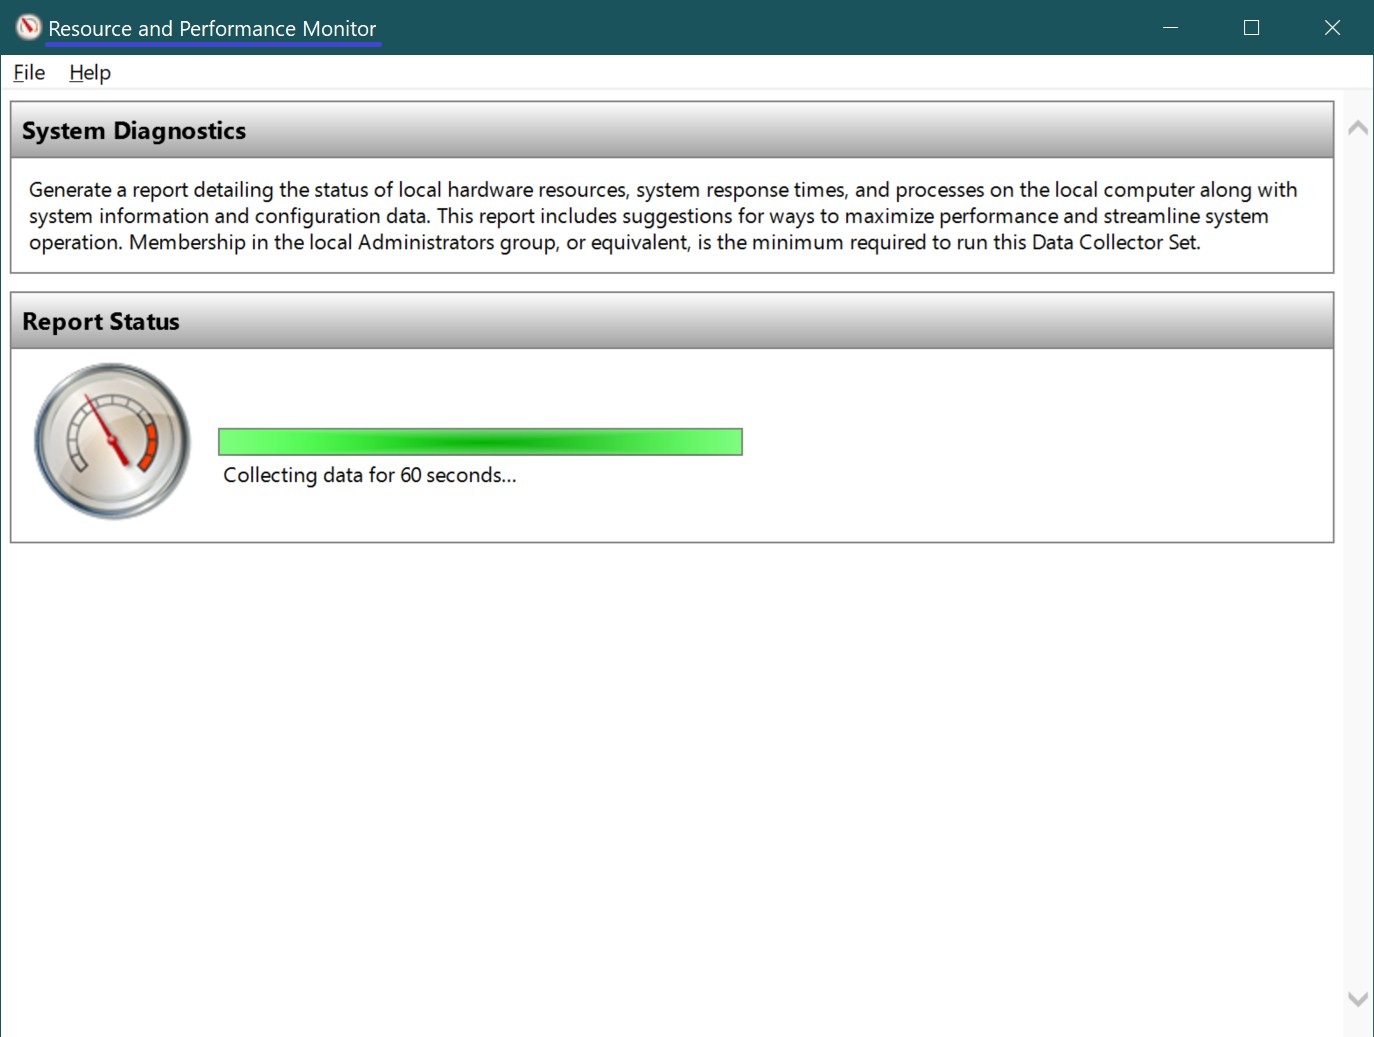
Press Win + R, type or paste the command perfmon /report, and press Enter.
You can also run this command from the Command Prompt — just make sure to launch it with administrator privileges.
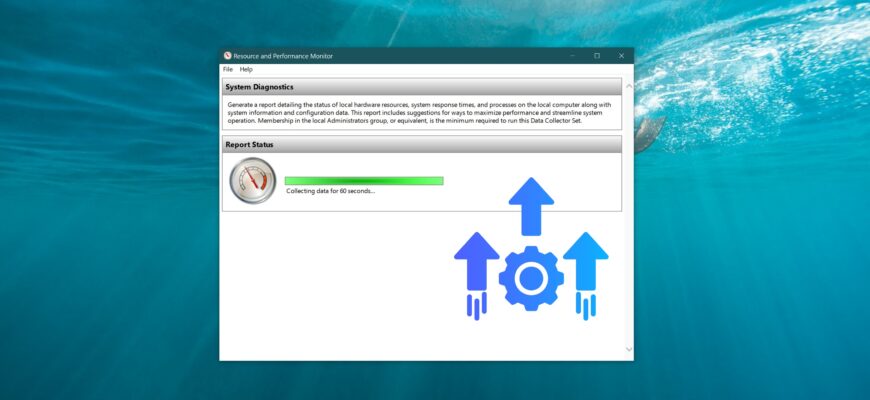
The Resource and Performance Monitor window will open, and the system will begin collecting data. This process typically takes about 60 seconds but may take longer depending on your system load.
As a result, a detailed report will be generated, organized into categories such as CPU, memory, disk, drivers, and more.
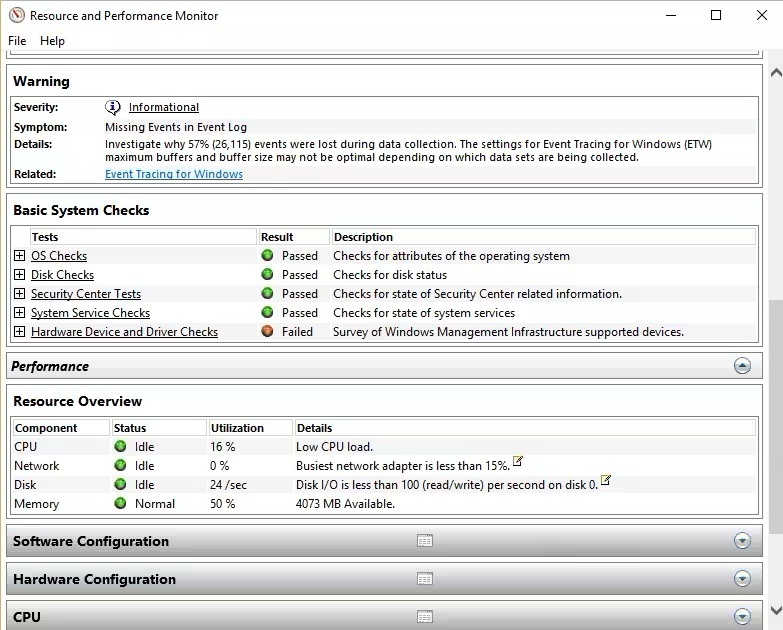
At first glance, the report may seem filled with technical terms. Here’s how to navigate it:
-
At the top of the report, you’ll see any errors, warnings, and suggestions.
-
Below that is a detailed breakdown of CPU usage, memory consumption, disk activity, network performance, and driver behavior.
-
If any issues are found, Windows will suggest possible solutions.
You can also save the report as an HTML or XML file for further analysis or to send to a support technician.
Another Way to Run the “System Performance” Check
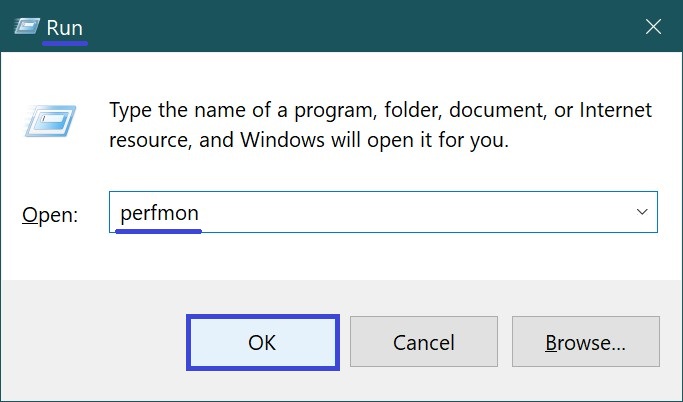
You can also run a system performance check using Performance Monitor. Press Win + R to open the Run dialog, type perfmon, and press Enter.
In the window that appears, expand the Performance section on the left panel, then open the Data Collector Sets folder and select System.
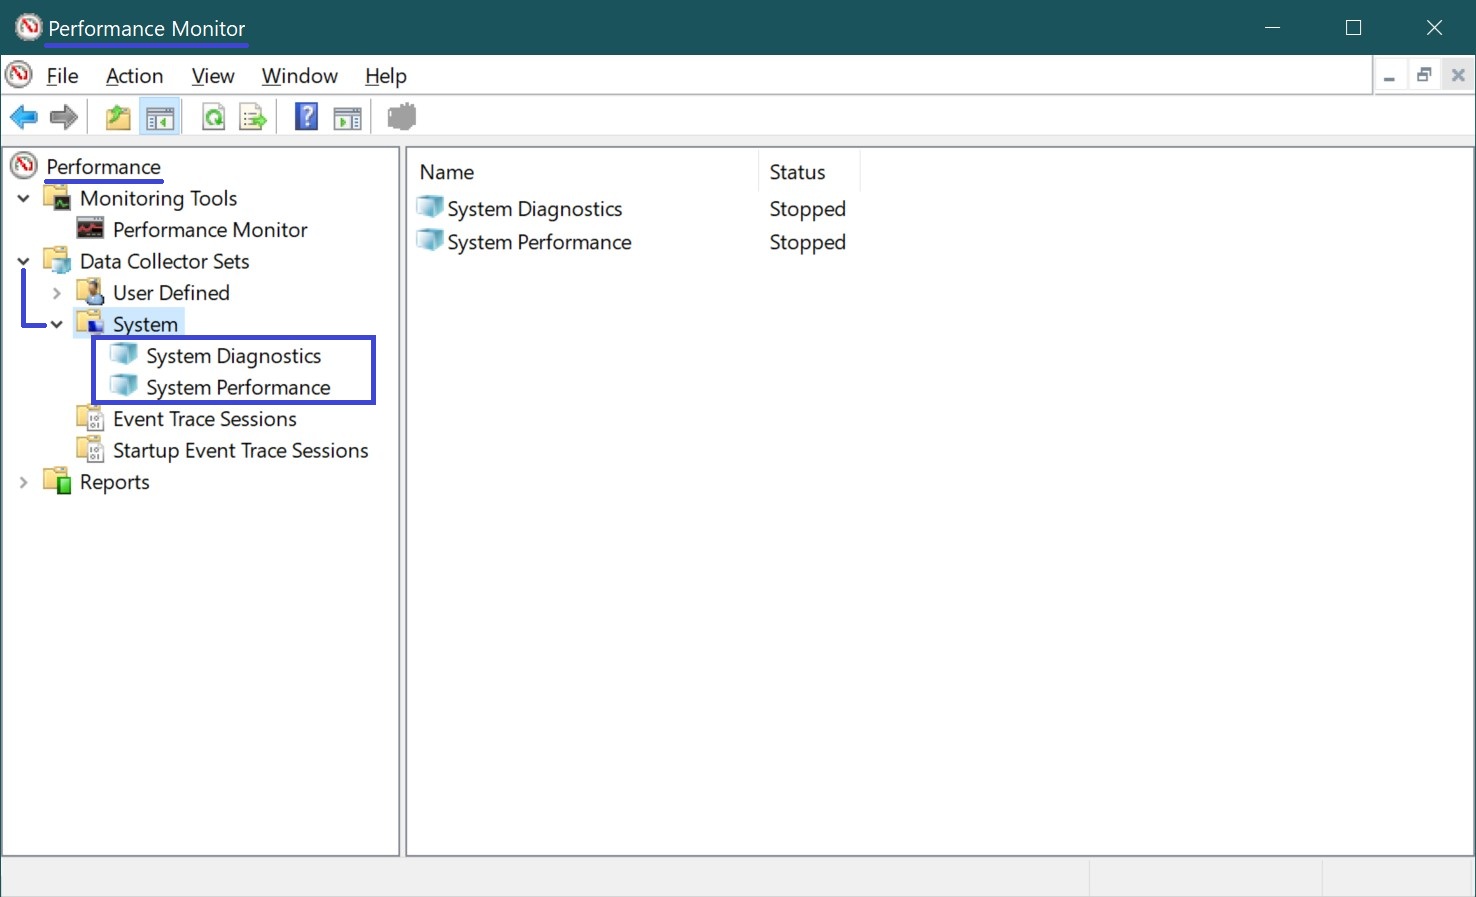
Here, you’ll find two types of checks available:
-
System Diagnostics
-
System Performance
Earlier in this article, we explained how the first report is generated — a more detailed diagnostic report that provides extensive information about your system and potential issues.
The System Performance report, on the other hand, offers an overview of the current system load and operation. It doesn’t include detailed warnings or recommendations, making it more suitable for quickly analyzing slowdowns or performance drops.
If you’re looking for in-depth system health insights, go with System Diagnostics. If you want to quickly pinpoint what’s slowing down your system right now, choose System Performance.
To start generating a report, right-click one of the two items and select Start from the context menu.
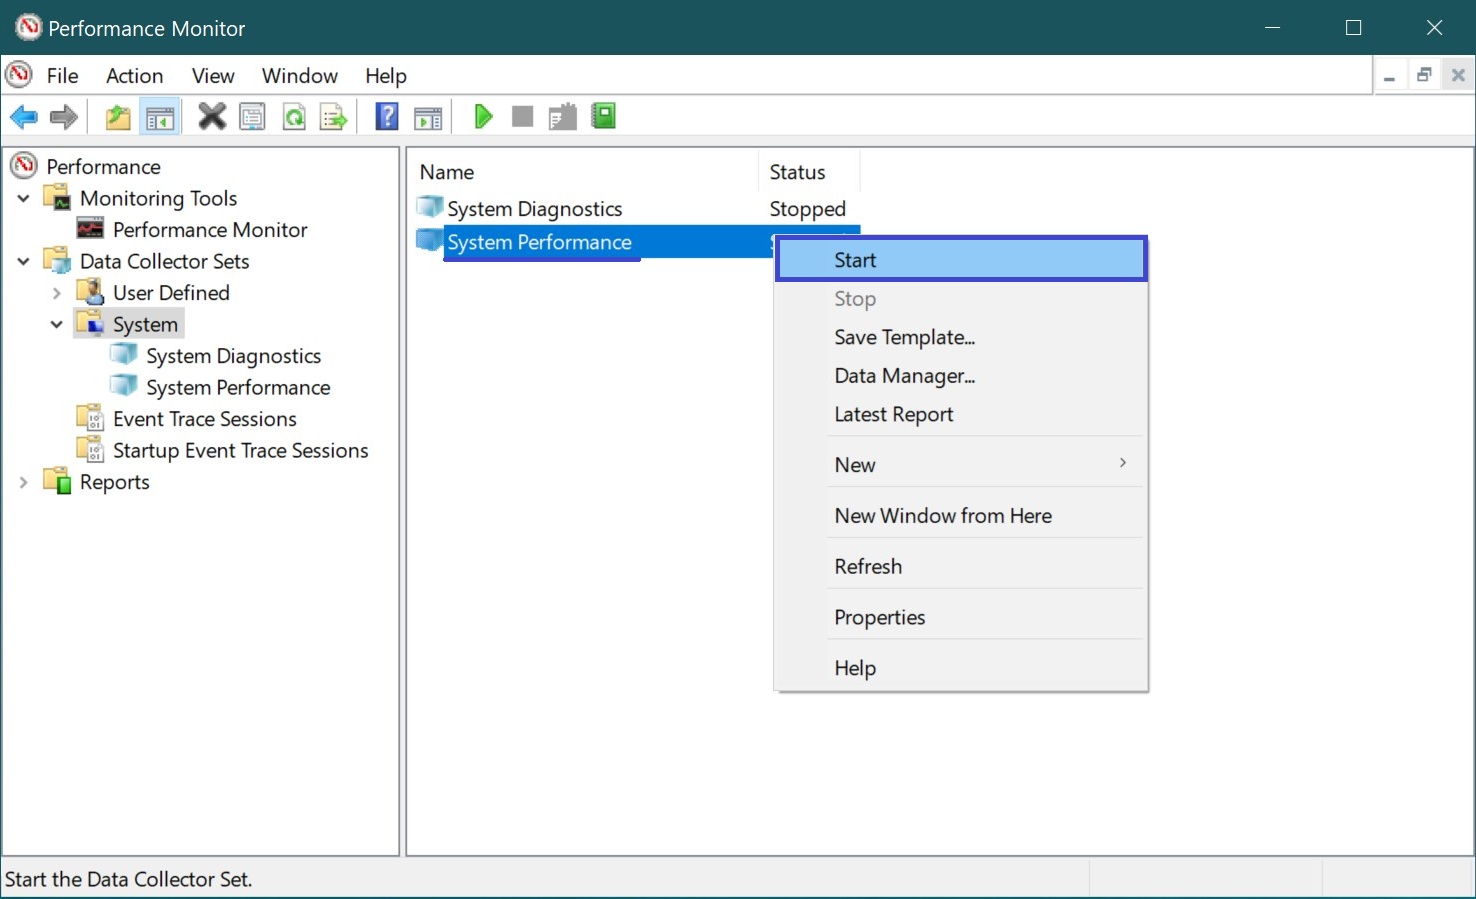
You’ll see an icon next to it indicating that data collection has started. Once the report is generated, the icon will disappear.
To view the final report, go to Reports > System, then select the report by date and time and double-click it. The format will be the same as the one created using the perfmon /report command.
The performance report is a powerful built-in Windows tool that helps detect issues and optimize your system without needing any third-party software. Even if you’re not a tech expert, simply generating this report can greatly assist with diagnosing problems and increasing the chances of restoring stable system performance.
By periodically creating and reviewing these reports, you can keep your system in good shape and catch potential performance threats early.